
When we launched our new brand, we took the opportunity to go beyond choosing our colors or logo. We wanted to make sure that everything we created consistently reflected who we are: a firm committed to clarity, accessibility, and impact. That’s why we decided to bring in a professional data visualization designer.
We weren’t looking for charts that just looked pretty (though they certainly do). We were looking for charts that communicated clearly, made participation easier, and honored our values of inclusion and transparency. In a world where data is becoming more complex — and data visualizations are often growing more complicated — we wanted to make sure that our graphics helped people engage, rather than shutting them out.
Why we brought in a data viz professional
We realized that even with strong internal aesthetics, doing data visualization well requires a different set of skills: design, storytelling, accessibility standards, and technical best practices. We wanted to make sure that our approach to data visualization was:
- Aligned with our brand identity
- Easy to understand for people without formal data training
- Accessible to people with visual impairments such as color blindness
- Consistent across a growing team
While I have written elsewhere (here and here) on how to align data visualization with your goals and organizational values, I just didn’t have the technical skill to do what we wanted to do. So, we found a partner (actually he found us) who could help us build a system that would work for the long haul. That’s where Christopher Johnson came in.
What Christopher built with us
Christopher’s work went far beyond design. He helped us think through how to balance beauty, clarity, and usability across everything we create. Some of the key contributions he made included:
Developing an accessible color system:
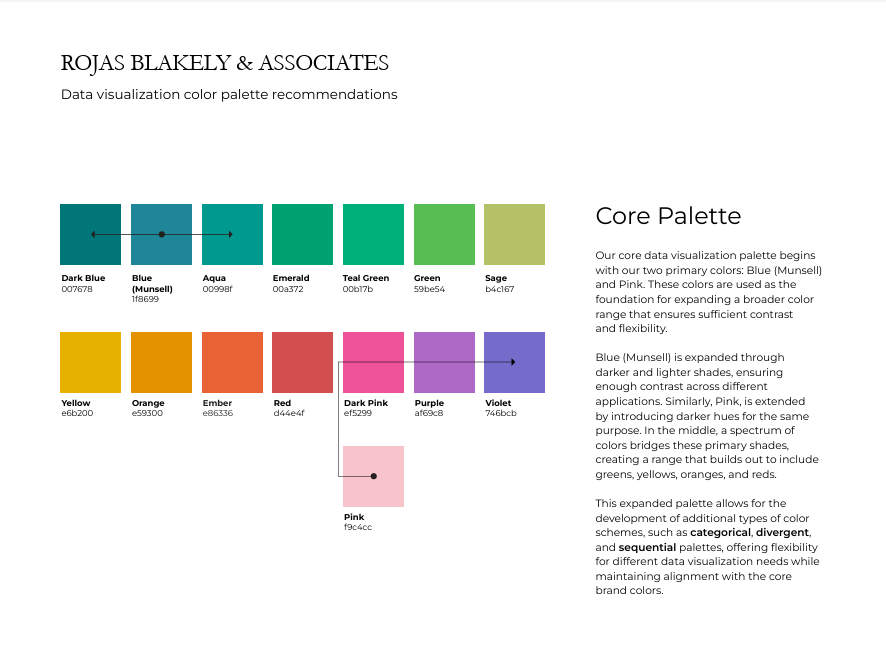
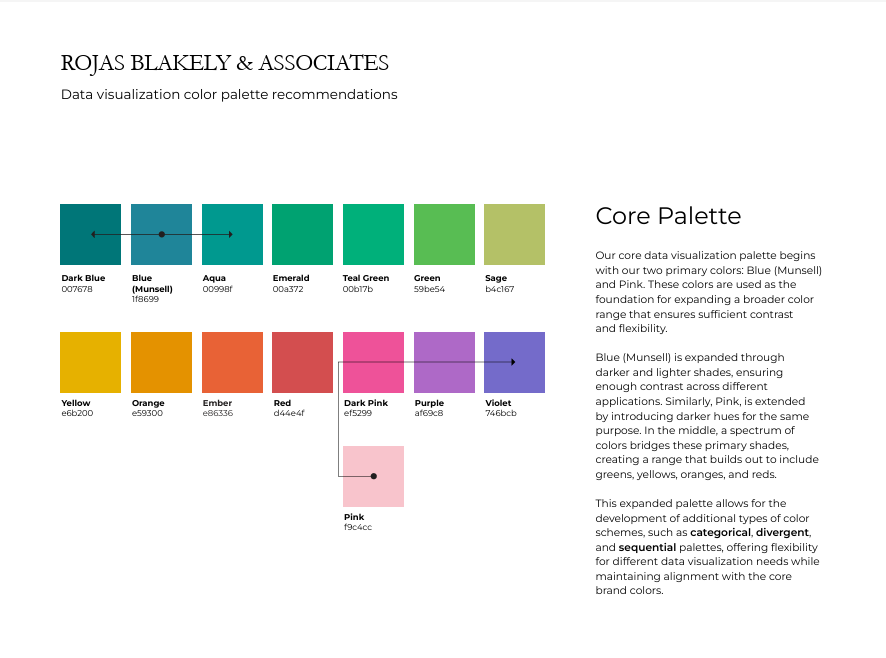
Christopher started with our brand palette but expanded it to create a full color set that would be more effective for data storytelling. He selected colors that harmonized with our brand identity but offered sharper contrast, clearer differentiation, and full accessibility for users with visual impairments.
In particular, he helped us address a major challenge: our brand’s light pink color, while beautiful, didn’t have enough contrast to stand alone in most data visuals. Christopher identified adjacent colors that kept the spirit of our pink while ensuring readability and compliance with accessibility standards.
Creating templates and tools for our team:
We needed charts that every member of our growing team could produce. Christopher designed a library of Excel templates that baked in all the key decisions: color palettes, font choices, line weights, chart types, spacing rules, and more. These templates make it easy for anyone on our team, regardless of design experience, to quickly create charts that are clear, on-brand, and effective.
Building a flexible system for future growth:
We worked with Christopher to create a style guide that documents our data visualization approach: when to use which charts, how to use color meaningfully, and what principles we follow. This gives us a clear foundation that supports consistency now — and gives us the flexibility to evolve as our needs grow.
How it helps our clients
Ultimately, this investment wasn’t just about making our internal work easier (though it has done that too). It was about doing a better job for our clients and the communities they serve. Here’s how:
Clarity for broader audiences:
Our charts are easier for everyone to read, including people who don't work with data every day, making our insights more inclusive and actionable.
Trust through consistency:
Professional, consistent visualizations reinforce our credibility and the credibility of the data we're sharing.
Better data storytelling:
By stripping away distractions and focusing attention on key messages, we help our clients and partners quickly understand what the data is saying — and what they might do about it.
As Christopher put it during our work together, "The goal of data visualization is to communicate, not decorate." We couldn't agree more.
Investing in professional data visualization has helped us live up to our brand promise: to make information clear, accessible, and meaningful — for everyone we work with. And it’s only the beginning. Next up? Icons.